How a Health Brand Lifted Revenue Per Visitor by 68%
KEY RESULT
+68% revenue per visitor
without increasing ad spend
Conversion Rate
2.6%
from 1.2%
Average Order Value
$76
from $54
Revenue Per Visitor
$1.09
from $0.65
Cart Abandonment Rate
61%
from 78%
The Challenge
This health and wellness brand had impressive traffic numbers — 45,000 monthly visitors driven primarily by Meta and TikTok campaigns that were generating strong CPCs. The problem was what happened after the click.
At a 1.2% conversion rate, they were converting roughly 540 customers per month. The category benchmark for health supplements sits at 2.2–2.8%. The gap wasn't a traffic quality problem — analytics showed strong intent signals (time on product page, scroll depth, repeat visits) — it was a conversion architecture problem.
The checkout abandonment rate of 78% was particularly telling. Customers were making it to checkout and leaving — which meant the product was compelling enough to consider, but something in the purchase flow was killing confidence at the critical moment.
What We Did
1. Full Funnel CRO Audit
We started with a structured 3-week audit: heatmaps, session recordings (500 sessions tagged by traffic source), exit surveys, and a technical performance review. Three issues emerged immediately:
- Product pages were leading with ingredient lists rather than outcomes — customers had to work to understand what the product would do for them
- The checkout had four friction points: no guest checkout option, required account creation, no trust signals at payment step, and a confusing shipping calculator
- Mobile UX was broken in two critical places: the "Add to Cart" button was below the fold on iPhone SE/12 mini, and product images didn't support pinch-zoom
2. Product Page Overhaul
We restructured the product page hierarchy: outcome-first headline, social proof (review count + star rating) above the fold, ingredient detail moved to an expandable accordion below. We rewrote the primary CTA copy from "Add to Cart" to copy specific to each product's primary benefit.
We also introduced a "compare sizes" module for products with multiple SKUs — previously customers were bouncing to figure out which size was right for them.
3. Checkout Friction Removal
We enabled guest checkout, added trust badges (SSL, satisfaction guarantee, 30-day returns) to the payment step, and replaced the shipping calculator with a clean "Free shipping over $65" banner. Account creation was moved to post-purchase with an incentive.
The single biggest win: adding a one-click upsell at checkout for a complementary product at a 20% discount. This is what drove the AOV increase from $54 to $76.
4. Mobile Experience Fixes
The CTA button placement fix alone improved mobile conversion rate by 0.4 percentage points within two weeks — measurable in a simple A/B test. Pinch-zoom on product images reduced bounce-to-category-page behavior on mobile by 22%.
The Results
After four months of iterative testing and implementation, conversion rate climbed from 1.2% to 2.6% — well above category benchmark. Combined with the AOV increase from the checkout upsell, revenue per visitor grew 68%.
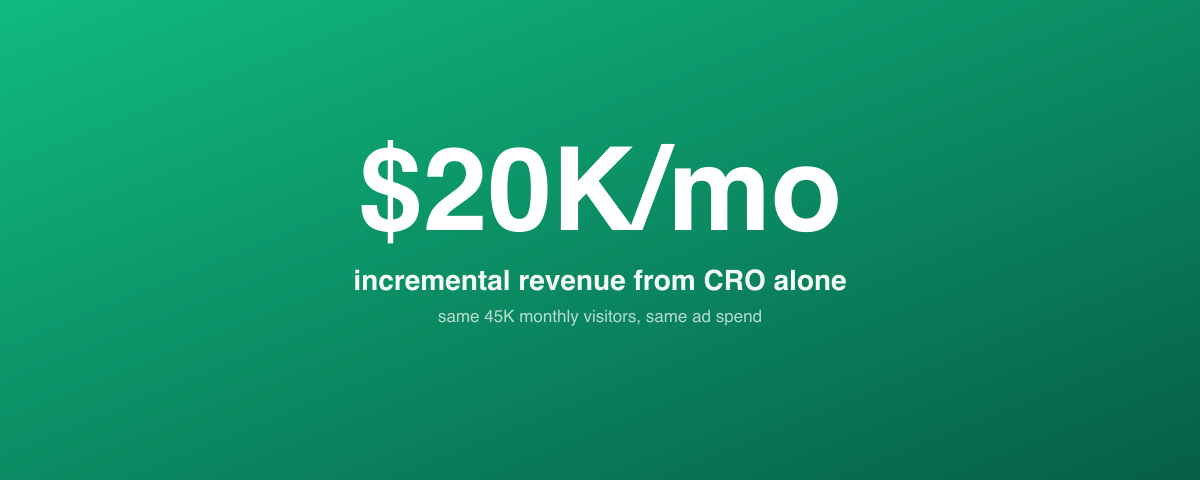
On the same 45K monthly visitors and the same ad spend, the brand was now generating $49K/month in revenue versus the previous $29K. That's $20K/month in incremental revenue from store optimization alone — without touching the media budget.
“We kept throwing money at ads thinking the problem was traffic quality. Turns out the store itself was the bottleneck. The CRO audit revealed things we never would have found on our own.”
— Co-Founder, Health & Wellness Brand
+ DEEPER READING
The tactics behind these results
Shopify CRO: The Complete Conversion Rate Optimization Guide for D2C Brands
Running ads to an unoptimized Shopify store is like pouring water into a leaky bucket. This is the complete guide to Shopify CRO — from product page anatomy to cart abandonment recovery to the LTV metrics that tell you whether you're actually winning.
Read guide →
SHOPIFY CROThe Anatomy of a High-Converting Shopify Product Page
Your product page is your most important sales asset. Breaking down the exact elements — in the exact order — that maximize add-to-cart rate and conversion for D2C brands.
Read guide →
SHOPIFY CROHow to Reduce Cart Abandonment by 30% (Without Discounting)
The average Shopify store loses 70% of carts. Most brands respond with discount emails — but there are smarter tactics that recover revenue without training customers to wait for deals.
Read guide →
SHOPIFY CROCheckout Optimization for Shopify: Recovering Revenue at the Last Step
The checkout is where purchase intent is highest and friction is most expensive. Here's how to audit and fix the Shopify checkout drop-off that's silently killing your conversion rate.
Read guide →