

A real-time dashboard is genuinely useful for exactly a handful of metrics, and mostly noise for the rest — but once a team has one, the instinct is to watch everything through it, all the time.
"A real-time dashboard is genuinely useful for exactly a handful of metrics, and mostly noise for the rest — but once a team has one, the instinct is to watch everything through it, all the time."
— Aashish Kasma, Co-Founder — Data & Analytics
The cost isn't just wasted engineering effort on live pipelines nobody needed. It's decisions made on noise that would have resolved itself by the next morning's data pull.
Which metrics actually need to be real-time?
A small set of metrics change fast enough, and cost enough if missed, to justify live monitoring:
- Site uptime and checkout errors — every minute of an undetected outage during a promotion is direct, unrecoverable revenue loss.
- Ad spend pacing during a launch or flash sale, where a budget cap or bid error can burn a day's spend in an hour.
- Inventory levels on hero SKUs during a promotion, where overselling creates a fulfillment and refund problem, not just a reporting one.
Everything else — ROAS, CAC, conversion rate, email revenue — is noisy at an hourly resolution and only becomes meaningful once enough volume has accumulated to smooth out normal variance.
Why does checking ROAS hourly actually make decisions worse?
Hourly ROAS swings wildly based on small-sample conversion timing — a single high-value order landing at 2pm can make a campaign look like it doubled its return in an hour, and a lag in conversion attribution can make an efficient campaign look dead for a stretch it wasn't. A manager watching that number live is reacting to noise, not signal, and the most common failure mode is pausing a campaign mid-day that would have looked completely normal by end of day. Blended vs. true ROAS is already a measurement problem before you add hourly volatility on top of it.
The rule of thumb If a metric needs at least a day of volume to be statistically meaningful, checking it more than once a day doesn't produce better decisions — it just produces more chances to react to noise.
What does a sane reporting cadence actually look like?
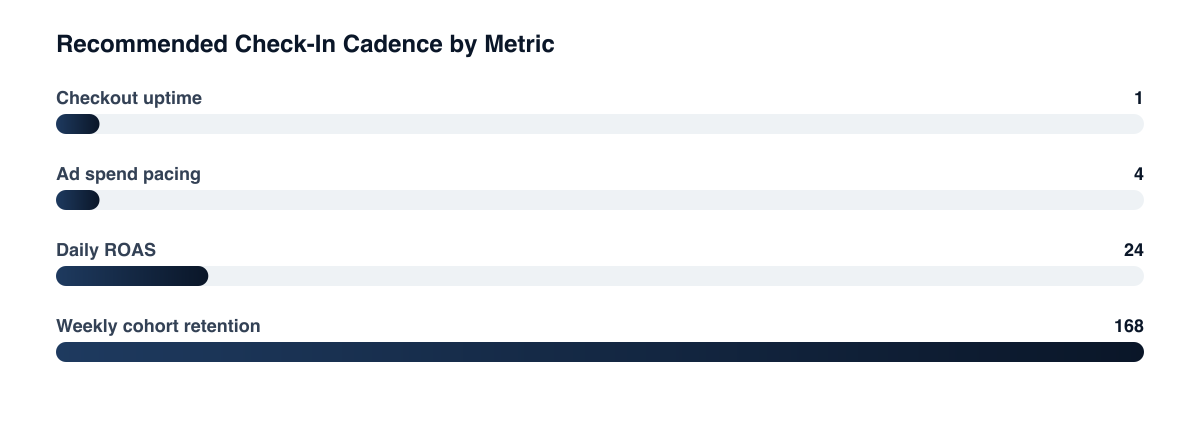
- Live dashboard: uptime, checkout errors, spend pacing during time-boxed promotions only — not a permanent fixture for evergreen campaigns.
- Daily: spend, ROAS, and conversion rate by channel, reviewed once each morning against the prior day, not watched continuously through the day.
- Weekly: cohort retention, CAC by channel, email/SMS revenue share — metrics that need enough volume to separate real movement from weekly noise.
- Monthly: LTV:CAC, marketing mix modeling outputs, and any metric that depends on a full purchase cycle completing before it's readable.
Doesn't more frequent visibility always help the team move faster?
It helps when the metric's underlying value actually changes that fast — inventory and uptime genuinely do. It doesn't when the metric is stable but the display makes it look volatile, which is what happens when hourly ROAS gets displayed with the same visual weight as a daily trend line. The fix usually isn't removing the live dashboard, it's being deliberate about which tiles sit on it and reserving the "check constantly" instinct for the two or three numbers where speed of reaction actually matters.
Related guides
- How to Build a Marketing Dashboard Your CFO Will Actually Love
- ROAS and Attribution: The Truth About Blended vs. True Return
- Cohort Analysis for D2C Brands: The Retention Metric Hiding in Your Revenue Dashboard
- Why Data Pipelines Are the Backbone of a Semantic Layer
Building the live view is the easy part once the pipeline is in place. The harder discipline is deciding which numbers actually deserve to be watched that closely — and leaving the rest for the daily and weekly review where they're actually readable.
PART OF OUR SERVICE
Data & Analytics
Want a free marketing audit?
We'll review your tracking, ad accounts, and funnel — and show you exactly where the gaps are.
Get Your Free Audit →