
Social commerce crossed $1.2 trillion in global GMV last year, and the platforms driving that number are not Pinterest boards or Facebook Marketplace — they are TikTok Shop and Instagram Shop. For D2C brands, the implication is straightforward: the checkout is now inside the feed, and every step you eliminate between discovery and purchase increases conversion.
"The checkout is now inside the feed, and every step you eliminate between discovery and purchase increases conversion."
— Nitesh Kasma, Co-Founder — Brand Strategy & Client Growth
The brands winning in social media commerce are not simply re-listing products. They are building native storefronts, building creator flywheels, and treating social channels as a distinct revenue line — not an attribution footnote.
What's the state of social commerce in 2026?
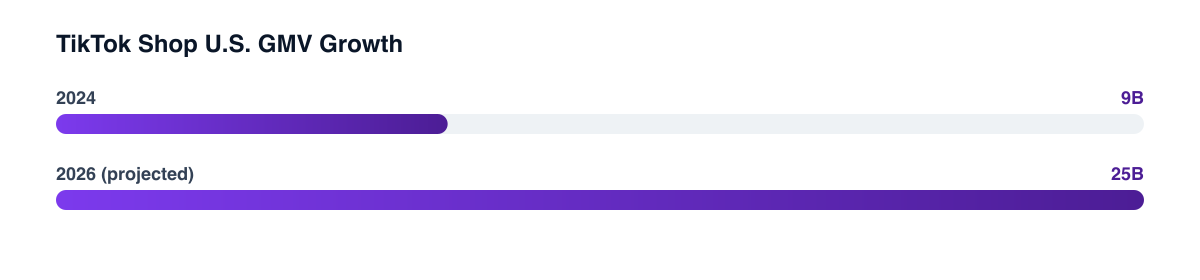
TikTok Shop is the faster-growing platform. U.S. GMV on TikTok Shop is tracking toward $25 billion this year, up from roughly $9 billion in 2024. Apparel, beauty, supplements, and home goods account for the bulk of that volume. Instagram Shop, backed by Meta's ad infrastructure, runs more predictably — lower viral ceiling, but steadier conversion rates and stronger average order values ($68 vs. $41 on TikTok).
The competitive dynamic matters. TikTok rewards discovery — unknown brands can go from zero to six figures in a week if a video hits. Instagram rewards authority — established brands with strong creative libraries convert better because the audience already has brand context when they tap the product tag.
Rule of thumb: use TikTok Shop for customer acquisition and virality; use Instagram Shop for conversion on warm audiences and repeat buyers.
How do you set up and optimize Instagram Shop?
The technical setup is table stakes: connect your product catalog through Meta Commerce Manager, sync your Shopify or WooCommerce store, and enable Instagram Checkout if you are in a supported market. Where most brands underperform is in how they use the storefront after setup.
Catalog hygiene is the highest-leverage variable. Product titles should match the language customers actually search — not your internal SKU naming. Descriptions need to front-load the key benefit in the first 60 characters, because that is all that renders in the product tile. Images should be square, high-contrast, and lifestyle-led rather than white-background pack shots.
Product tags in posts and Reels drive the majority of Shop traffic. Tag products in every eligible post — not just dedicated shopping content. A Reel that was produced for brand awareness performs differently when a viewer can tap through directly. Instagram data shows tagged Reels drive 3–5x more product page visits than equivalent untagged content.
For Checkout setup, the decision is whether to use Instagram's native checkout or redirect to your website. Native checkout captures impulse purchases but limits your post-purchase data and email acquisition. Redirect to site preserves your Shopify CRO funnel and first-party data. For most D2C brands selling above $60 AOV, redirecting to a high-converting PDP is worth the extra click. Below $40, native checkout wins.
What are the TikTok Shop mechanics?
TikTok Shop has three distinct traffic surfaces: in-video product links, the Shop tab, and live shopping. All three operate differently and reward different tactics.
In-video product links are the entry point. Pin a product card to an organic video, and viewers can tap directly to checkout without leaving TikTok. The key is that the video must make the product the logical conclusion of the content — not a tag bolted onto an unrelated post. Demonstration-style videos (before/after, how-it-works, unboxing) convert 40–60% better than talking-head testimonials.
Live shopping is where TikTok's GMV concentration sits. Top-performing brands run 2–3 lives per week, with streams lasting 60–90 minutes. Live commerce works because urgency is real — limited-quantity drops, flash discounts, and host interaction create a buying environment that static posts cannot replicate. Average conversion rates on TikTok Live hover around 8–12% for warm audiences, compared to 2–4% for standard video product links.
The affiliate program is the unlock most brands underuse. TikTok's Creator Marketplace lets you set a commission rate (typically 10–20%) and open your catalog to creators who want to earn on sales. This is not influencer marketing in the traditional sense — you are not paying upfront, you are paying on performance. A brand with a well-structured affiliate program can activate hundreds of creators without any guaranteed spend, and the best-performing creators naturally self-select toward higher-commission, higher-conversion products.
Brands running 50+ active TikTok Shop affiliates report that 80% of affiliate GMV comes from 15–20% of creators. Identify your top performers early and give them exclusive offers, early product access, and higher commission tiers.
What products and price points actually work?
Social commerce is not a channel for every SKU. The products that convert best share three traits: they are visual, they have an obvious use case that can be demonstrated in under 15 seconds, and they carry enough margin to absorb a 15–25% channel fee.
Price point sweet spot: $25–$85. Below $25, the economics break down after platform fees and shipping. Above $85, buyers typically want to research before purchasing, which means your website or Amazon vs. DTC considerations become more relevant than social checkout.
Categories with strong social commerce performance: skincare and cosmetics, supplements (especially gummies and functional beverages), home organization, kitchen gadgets, apparel basics, and pet products. Categories that struggle: considered purchases above $150, anything requiring size or fit consultation, and products where trust or safety credentials are the primary purchase driver.
How do you measure social commerce separately from DTC revenue?
Social commerce needs its own reporting layer. If you roll TikTok Shop and Instagram Shop revenue into your blended DTC metrics, you will misattribute performance, make wrong budget decisions, and miss channel-specific optimization opportunities.
At minimum, track these separately: revenue by platform, units sold by platform, average order value by platform, returns rate by platform (social commerce returns run 2–4% higher than site averages), and new vs. returning customer split.
Platform dashboards give you the surface metrics. For deeper analysis, pull TikTok Shop and Instagram Shop order data into your data warehouse and segment by product, creator source, and traffic surface. The question you are ultimately trying to answer: which products, at which price points, driven by which content or creator, produce the highest contribution margin after platform fees and returns?
How do you use creator partnerships to drive social commerce volume?
The brands scaling fastest on social commerce are not running ads — they are running creator programs. The model is straightforward: give creators affiliate links or product codes tied to your TikTok Shop or Instagram Shop catalog, pay on performance, and let the best content rise.
The operational piece is where most brands stall. Managing 50 creators manually is not scalable. Use TikTok's Creator Marketplace or platforms like Grin or LTK to manage outreach, contracts, and commission tracking at scale. Brief creators on the product benefit and the content format that converts — then give them latitude on execution. Scripted creator content underperforms authentic demonstration by a significant margin.
For Instagram Shop specifically, micro-creators (10K–100K followers) in niche verticals consistently outperform macro-influencers on product conversion. Their audiences are tighter, their recommendation carries more weight, and their rates are 60–80% lower per post.
The bottom line
Social commerce in 2026 is a real revenue channel, not a marketing experiment — but it rewards brands that treat it as infrastructure, not an add-on. Build your catalog correctly, activate creators on performance deals, and measure social commerce as its own P&L. The brands doing that are compounding GMV while everyone else debates attribution.
Related guides
PART OF OUR SERVICE
Social Media
Want a free marketing audit?
We'll review your tracking, ad accounts, and funnel — and show you exactly where the gaps are.
Get Your Free Audit →