
Your ICP is probably wrong. Not because you didn't think hard about it — but because it was built from opinions, not data. "Mid-market SaaS companies with 50–500 employees who want to grow faster" describes roughly 40,000 companies and tells you nothing about who will actually buy, renew, and refer.
A bad ICP wastes budget at every stage. Marketing generates leads that sales won't touch. Sales calls companies that can't afford the product. The pipeline looks full but conversion stays stuck at 2–3%. The fix isn't a better template. It's a different methodology.
Why do most ICPs fail?
Most ICPs are aspirational documents. They describe the customer a leadership team wants, not the customer who consistently closes, pays on time, and churns the least.
Three failure modes come up constantly:
Built from the top down. A founder or VP of Sales defines the ICP in a meeting room based on gut feel and a few memorable wins. No one checks whether those wins actually represent the broader closed-won cohort.
Too broad to be useful in targeting. "Director-level and above at B2B SaaS companies" is not a targeting input. LinkedIn has 2.3 million people matching that description in North America alone.
Never updated. An ICP written in year one gets copy-pasted into every deck and campaign brief without revisiting whether the customer base has shifted. As you scale into new segments, yesterday's ICP actively misdirects spend.
How do you build the ICP from closed-won data?
Pull your last 50–100 closed-won deals — or all of them if you're earlier stage. For each deal, document:
- Industry and sub-vertical
- Company size (headcount and revenue range)
- Buyer title and seniority
- Annual contract value (ACV)
- Sales cycle length
- Primary pain point at the point of purchase
- Where the lead originated
Then look for clustering. You're not looking for who you want — you're looking for who already closes fastest, pays the most, and sticks around longest. Run the same analysis on churned accounts and draw the contrast.
A useful ICP has at least two tiers: the "best fit" segment (top 30% of accounts by LTV) and the "good fit" segment. Anything below that is not your ICP — it's a stretch deal.
Cross-reference ACV with sales cycle length. If your fastest-closing deals have a 30-day cycle but your highest-ACV deals average 90 days, you have two distinct ICP profiles with different unit economics. Both may be worth pursuing, but they require entirely different campaigns, messaging, and channel mixes.
How do you layer firmographic and technographic signals?
Once you've identified the firmographic baseline — industry, company size, revenue range, team size in the relevant department — add technographic signals to sharpen targeting further.
Technographics answer a critical question: what does this company's current stack tell you about their readiness and fit?
A company running Salesforce and HubSpot together is often mid-transition and actively buying. A company on a legacy CRM from 2014 may be about to modernize — or may be locked in for three more years. A company spending on Google Ads and LinkedIn simultaneously signals a mature demand gen function with budget to spend on supporting tools and services.
Data providers like Bombora, Clearbit, and Apollo surface this at scale. For B2B lead generation, combining firmographic filters with technographic signals typically lifts MQL-to-SQL conversion by 20–35% compared to firmographic data alone.
The signals worth prioritizing: CRM platform, marketing automation tool, hiring velocity in sales and marketing roles (a leading indicator of budget availability), and recent funding events.
How do you operationalize the ICP in LinkedIn targeting?
LinkedIn is the primary paid channel where ICP precision translates directly into cost efficiency. The platform's targeting is only as good as the parameters you feed it — and most B2B advertisers use it too broadly.
When translating your ICP into LinkedIn campaign settings:
- Use company size ranges that match your closed-won data precisely. If your best-fit accounts have 200–1,000 employees, don't expand to 51–10,000 to chase volume.
- Layer job function + seniority rather than job title alone. Titles vary wildly across companies; function + seniority is more stable.
- Use Company List targeting for your highest-fit account segment — upload a CSV of target accounts and target only employees at those companies.
- For retargeting, build audiences from website visitors who hit high-intent pages (pricing, case studies, ROI calculator) and cross-reference with company match to suppress non-ICP traffic.
For a deeper breakdown of channel economics, B2B Lead Generation: LinkedIn Ads vs. Google Search covers where each channel wins at different funnel stages and deal sizes.
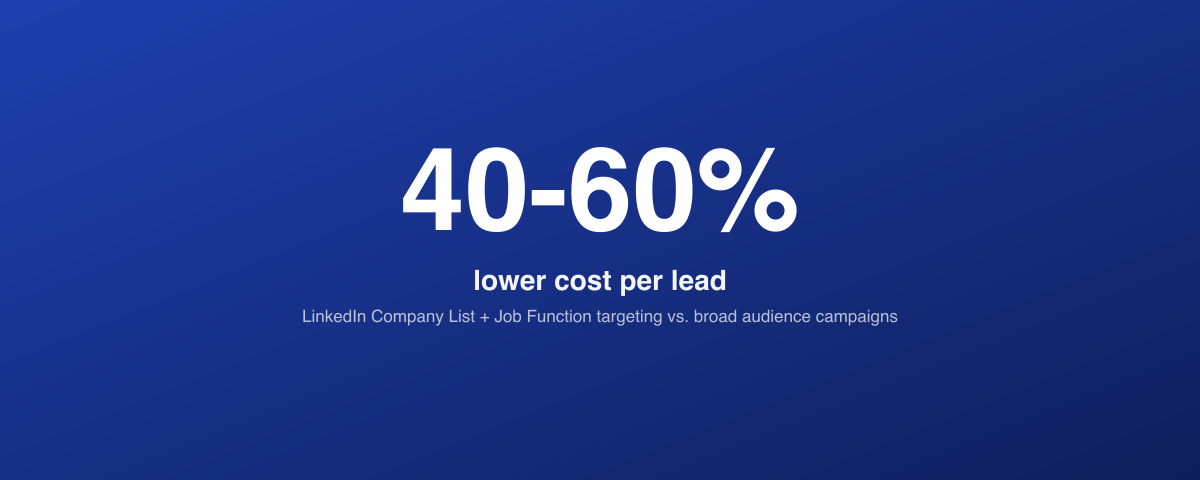
One benchmark worth noting: LinkedIn campaigns with Company List + Job Function targeting typically achieve CPLs 40–60% lower than broad audience campaigns in the same account — at the cost of reach. That tradeoff is almost always worth making once you have a validated ICP.
How do you use the ICP to filter inbound and qualify outbound?
An ICP only creates leverage when it's embedded in your qualification process, not just your targeting.
For inbound, gate your lead forms to collect the data points that match your ICP criteria: company size, industry, job title, current tool stack. Score leads automatically on submission. Any lead outside your ICP should enter a nurture sequence, not an SDR queue. Every hour an SDR spends on an out-of-ICP lead is an hour not spent on a qualified one.
For outbound, your ICP becomes the filter for every prospecting list you build. Before a rep makes a single call, the account should already match on industry, size, tech stack, and buying signals. If your SDR team is building lists manually from LinkedIn Sales Navigator without a documented ICP filter, expect 60–70% of their outreach to land on accounts that will never convert.
Connect your ICP-qualified pipeline data to your revenue reporting. If your CFO is asking why pipeline volume is up but revenue is flat, the answer is usually ICP drift. The marketing dashboard framework for CFOs covers how to surface this kind of signal in a way finance will actually engage with.
How do you update the ICP as you scale?
Your ICP is a living document. Every six months, rerun the closed-won analysis. As you add customers, the cohort shifts — sometimes in ways that unlock entirely new segments, sometimes in ways that reveal you've been chasing the wrong profile.
Watch for three signals that your ICP needs updating:
- Sales cycle length is increasing — you may be moving upmarket faster than your ICP reflects
- Churn is concentrated in a specific firmographic segment — that segment belongs in a separate tier or off the ICP entirely
- A new industry or use case appears in closed-won data unprompted — an adjacent segment may be maturing into a primary one
When you enter a new segment deliberately — new geography, new industry vertical, upmarket move — treat it as a separate ICP hypothesis and validate it against a fresh closed-won cohort before allocating significant budget.
The bottom line
An ICP built from closed-won data, layered with technographic signals, and embedded in your qualification workflow will outperform a consensus-built persona every time. The goal isn't a sharper slide — it's a sharper filter that makes every acquisition dollar work harder.
"The goal isn't a sharper slide — it's a sharper filter that makes every acquisition dollar work harder."
— Nitesh Kasma, Co-Founder — Brand Strategy & Client Growth
Related guides
PART OF OUR SERVICE
B2B Lead Generation
Want a free marketing audit?
We'll review your tracking, ad accounts, and funnel — and show you exactly where the gaps are.
Get Your Free Audit →