How Crossword Scaled Online Revenue 2.7x While Cutting CAC by 60%
KEY RESULT
2.7x revenue growth
from ₹27L to ₹72L monthly online revenue
Monthly Online Revenue
₹72L
from ₹27L
Customer Acquisition Cost
₹1,250
from ₹3,200
Blended ROAS
3.6x
from 1.7x
Seasonal Peak Revenue
+43% YoY
from Baseline
The Challenge
When Crossword came to us, they had already made the shift to taking their online channel seriously. Post-pandemic, their e-commerce business had grown meaningfully — but growth had stalled, and the economics had quietly deteriorated.
They were spending roughly ₹16L/month across Meta and Google with a headline blended ROAS of 1.7x. On the surface, that looks like a margin problem. In reality, it was a measurement and structure problem — but the numbers weren't revealing that. Their Meta dashboard was showing 2.3x ROAS. Google was reporting 1.2x. The discrepancy made optimization impossible: one platform looked like it was working, the other looked like it wasn't, and neither number was trustworthy.
Compounding this, their Google Shopping account had grown organically — a single campaign containing every SKU, running on a single broad tROAS target. Crossword's catalog — thousands of titles across wildly different price points, margin profiles, and purchase intent signals — was being treated as one homogeneous product catalog. High-margin stationery sets and ₹350 paperbacks were competing for the same bid.
Seasonal campaigns were reactive. Diwali, back-to-school, and Christmas gifting are the three moments that define a book retailer's year — but creatives were being briefed two weeks before launch, with no structured audience pre-loading or budget ramping plan.
What We Did
1. Attribution Audit and Source-of-Truth Rebuild
We spent the first three weeks doing nothing but measurement work. We mapped every conversion path — Meta click, Meta view-through, Google brand search, Google Shopping, direct — against actual Shopify order data.
The central finding: approximately 28% of Meta's attributed conversions were branded Google searches. Customers were discovering the brand on Instagram, then searching for it by name on Google to complete the purchase. Meta was claiming that revenue. Google brand search was also claiming it. Both platforms were right by their own attribution models — and both numbers were wrong in the context of actual incremental revenue.
Once we normalized attribution using a data-driven model (first non-brand touch initiating the journey, last paid touch closing it), the real picture emerged: Meta's true contribution was closer to 1.4x ROAS, while Google Shopping — even with its structural problems — was generating 2.1x on the subset of well-matched queries. The implication was clear: we needed to fix Google Shopping first, tighten Meta's targeting second, and route the budget accordingly.
2. Google Shopping Restructure by Category and Intent
We rebuilt the Shopping account from scratch with a four-campaign structure:
Campaign 1 — High-margin categories (stationery, gifts, premium hardcovers). Aggressive tROAS of 4.5x, targeting higher-intent searches with more budget authority. These products had the margin to support higher CPCs and the conversion rates to justify it.
Campaign 2 — Core fiction and non-fiction. The volume engine. tROAS of 3.2x, built for scale. Titles and authors with existing demand signals got Priority High placement; backlist titles ran on Standard.
Campaign 3 — Children's books. Separate campaign entirely because the audience, seasonal patterns, and creative signals are completely different from adult book buyers. Gifting intent is much higher, and the seasonal curve peaks earlier (back-to-school July–August, then Christmas).
Campaign 4 — Long-tail and test. Low-spend holding space for new arrivals and experimental product types. Nothing in here got scaled until it proved a minimum ROAS threshold.
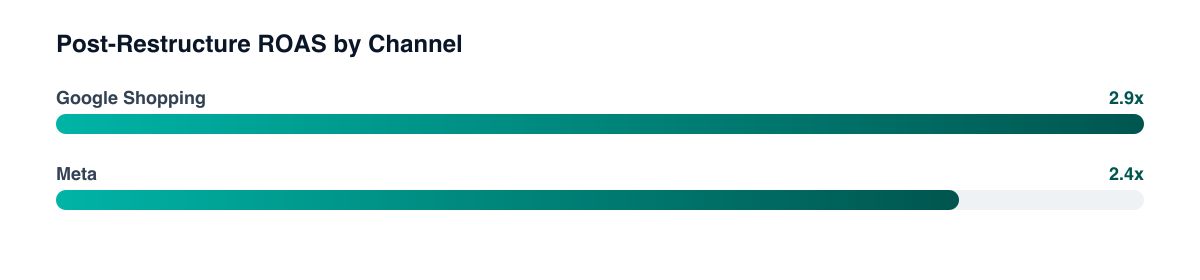
Within six weeks, Shopping ROAS improved from 1.2x (blended, all SKUs) to 2.9x (campaign-weighted), driven almost entirely by the high-margin category campaign pulling far above its target.
3. Meta Restructure Around Gifting and Reader Identity
Meta's role for a book brand is different from most D2C categories. The immediate-purchase intent is lower than Google Shopping, but the gifting opportunity is significant and the audience targeting signals (book clubs, reading habits, author fans) are genuine. We rebuilt the account around two distinct jobs.
Gifting audiences. We created separate ad sets targeting purchase intent indicators: people with upcoming anniversaries and birthdays, people who had engaged with gifting content, lookalikes of multi-item purchasers (high AOV signals gifting behaviour). These audiences were fed UGC-style creatives showing curated gift sets and wrapped book bundles rather than single-title ads.
Reader identity audiences. Interest-based audiences around specific genres, authors, and reading communities. These ran much lower budgets with the goal of building a retargetable warm audience pool rather than immediate conversion. Longer attribution windows, patience for the discovery-to-purchase cycle.
We cut Meta's total budget by 22% while reallocating from broad conversion campaigns toward these two focused segments. By month two, Meta's clean ROAS was 2.4x — up from the corrected 1.4x baseline — on lower absolute spend.
4. Seasonal Campaign Calendar
We mapped out the three peak periods with a structured ramp protocol: creative briefed eight weeks before peak, audience pre-loading (engagement campaigns, email list remarketing uploads) three weeks before, and budget ramping two weeks before. No more reactive launches.
For the Diwali window, we ran a "books as gifts" campaign across Meta and YouTube pre-roll targeting corporate gifting decision-makers alongside consumer gifters. Google Shopping bids were increased 40% on high-margin gift-relevant categories in the three weeks before the peak. The result was a 43% revenue increase versus the prior year's Diwali period, achieved with only a 12% increase in ad spend.
The Results
By month five, monthly online revenue had grown from ₹27L to ₹72L — a 2.7x increase. More importantly, the unit economics finally worked: CAC dropped from ₹3,200 to ₹1,250, and blended ROAS stabilized at 3.6x across both platforms on a clean, double-counting-free attribution model.
The structural change that compounded everything was the Shopping restructure. By separating high-margin categories from volume categories, the account had clear optimization targets for each segment rather than one blended number that masked where money was being made and where it wasn't. That visibility unlocked faster decisions and eliminated the budget drag from over-investing in low-margin product categories.
The seasonal Diwali result — 43% peak revenue growth on 12% incremental spend — was the clearest proof point that the prior underperformance had been structural, not a ceiling on demand.
“We had always known there was more headroom in our online channel — we just couldn't find it. The attribution work alone changed how we make every budget decision.”
— Head of E-Commerce, Crossword
+ DEEPER READING
The tactics behind these results
Meta Ads for D2C Brands: The Complete 2026 Playbook
Everything you need to run profitable Meta ads for your D2C brand in 2026 — campaign structure, creative strategy, tracking setup, audience architecture, and the exact frameworks we use to scale accounts from $10k to $500k/month.
Read guide →
PAID SEARCHGoogle Ads for D2C Brands: The Complete 2026 Playbook
The complete guide to running Google Ads for D2C brands in 2026 — Shopping campaign structure, Performance Max vs Standard Shopping, search ads strategy, feed optimization, and how to scale budgets without tanking efficiency.
Read guide →
PERFORMANCE MARKETINGWhy Your ROAS Is Lying to You (And How to Fix It)
Most D2C brands trust their reported ROAS blindly — but platform-reported ROAS is almost always inflated. Here's why, and how to calculate your true blended ROAS.
Read guide →
PERFORMANCE MARKETINGHow to Scale Ad Budgets Without Killing Performance
Doubling your ad budget doesn't double your results — it often tanks them. Here's the framework for scaling spend gradually while protecting ROAS and efficiency metrics.
Read guide →