
Shopify's built-in analytics are fine for answering questions you already know how to ask: today's revenue, top-selling products, sessions by traffic source. They are useless for answering the questions that actually drive performance marketing and business decisions: what is the LTV of customers acquired from Meta vs. Google? Which product is acquired the most new customers but retains the fewest? What does MoM revenue look like when you strip out one-time promotional events? For those questions, you need a stack beyond Shopify's native reporting — and most D2C brands either haven't built one, or have built one badly.
This is the architecture that works.
Why does Shopify analytics hit a wall?
Shopify's analytics are session-level and order-level by design. They were built to answer merchant questions — inventory, fulfillment, payment processing — not marketing analytics questions. The core limitations:
Attribution is last-touch only. Shopify attributes a sale to the most recent UTM source before purchase. Every order attributed to "direct" traffic was, in many cases, acquired through a paid ad or email that happened to lack UTM tracking on the final click, or a customer who opened the direct URL after seeing an ad. Last-touch attribution misrepresents which channels are driving acquisition.
No customer-level cohort analysis. Shopify can show you sales by month, but it can't easily show you the revenue generated in month 6 by customers acquired in month 1 vs. month 3. Cohort analysis — the foundational tool for understanding LTV trajectories and the payback period of your CAC — requires joining customer acquisition dates with subsequent order history in a way that Shopify's reporting UI doesn't support.
No cross-channel cost data. Shopify doesn't know what you spent on Meta, Google, or TikTok to generate its revenue. ROAS calculations are impossible natively. You can't see contribution margin by channel because cost data lives in the ad platforms, not in Shopify.
Limited custom segmentation. Filtering orders or customers by arbitrary combinations of attributes — customers from New York who bought product A and then bought product B within 60 days — requires raw data access. Shopify's filtering UI covers common cases and not much else.
These are not bugs; they're scope limitations. Shopify is a commerce platform, not a data warehouse.
"Shopify is a commerce platform, not a data warehouse."
— Aashish Kasma, Co-Founder — Data & Analytics
The solution is to move your data to a place designed for this type of analysis.
Layer 1: How do you get the data out of Shopify?
The first layer of the analytics stack is Shopify data extraction — getting your orders, customers, products, and events into a format you can work with.
Shopify API. The Shopify Admin REST API and GraphQL API expose all of your store data. Orders, customers, products, refunds, and inventory are all accessible programmatically. For brands with engineering resources, a custom ETL pipeline that writes Shopify data to BigQuery or Snowflake nightly is straightforward to build and maintain.
Fivetran or Airbyte. For brands without dedicated engineering, Fivetran and Airbyte offer pre-built Shopify connectors that handle data extraction and loading automatically. Fivetran's Shopify connector replicates all standard Shopify objects to your destination warehouse with configurable sync frequency. Airbyte is open-source and self-hosted, which makes it cheaper but requires operational overhead. Both are faster to production than a custom pipeline and eliminate maintenance burden from the team.
Triple Whale. For brands that want Shopify analytics without building a data warehouse stack, Triple Whale sits in the middle — it connects to Shopify, your ad platforms, and your email tool, and provides a unified dashboard without requiring a warehouse. The tradeoff is that it's a SaaS layer on top of your data rather than your data in a place you fully control. It's excellent for daily operational reporting but limited for ad-hoc analysis.
The right choice depends on your organization's data maturity and engineering capacity. Brands with a data analyst or data engineer should build the warehouse stack. Brands without should start with Triple Whale and migrate to a warehouse when the analytics questions get complex enough to require it.
Layer 2: what's the data warehouse?
BigQuery and Snowflake are both excellent choices. BigQuery has a pricing model (pay-per-query) that tends to be cheaper for intermittent query patterns, and integrates naturally if you're already in Google Cloud. Snowflake's separation of compute and storage gives you more control over cost optimization at scale. For most D2C brands under $50M in revenue, either is fine — the warehouse choice matters less than getting data into it reliably.
What should live in your warehouse:
Shopify orders table. Every order with customer ID, order ID, revenue, discount, items purchased, order source (channel/UTM), and timestamps. This is the foundation for all LTV, cohort, and channel analysis.
Shopify customers table. Customer IDs, acquisition dates, total orders, total spend, email, location, and any custom tags applied in Shopify. Joined to the orders table, this gives you the customer-level view.
Ad platform spend data. Meta Ads, Google Ads, and TikTok Ads spend, impressions, clicks, and conversions by campaign, ad set, and ad — synced daily. Most brands use a tool like Funnel.io, Supermetrics, or the native Fivetran connectors for this. Landing cost data in the same warehouse as revenue data makes channel-level ROAS calculations a single SQL query.
Klaviyo email and SMS data. Email sends, opens, clicks, and revenue attributed by Klaviyo — synced to the warehouse. Joining Klaviyo revenue attribution with Shopify orders lets you assess how much of Klaviyo's attributed revenue overlaps with ad-attributed revenue (the double-counting problem) and get closer to true channel contribution.
Post-purchase survey responses. If you run post-purchase surveys with Fairing or KnoCommerce, route survey responses to the warehouse. The "where did you hear about us?" data is your incrementality proxy and should be stored alongside all other channel data for comparison.
Layer 3: what's the semantic layer and BI tool?
Raw tables in BigQuery are not a reporting tool. The next layer is either a BI tool with its own semantic layer or a dedicated semantic layer like dbt.
dbt (data build tool). dbt is a SQL-based transformation tool that runs inside your warehouse. You define reusable models — customer_ltv, channel_roas, cohort_revenue — as SQL transformations, and dbt runs them on a schedule to produce clean, documented, test-covered tables that your BI tool queries. The benefit: transformations are version-controlled, documented, and trustworthy. The cost: requires a SQL-comfortable analyst or data engineer to maintain.
Data Studio (formerly Looker Studio). Free, connects to BigQuery natively, and is sufficient for most D2C reporting needs. Not the most performant or feature-rich BI tool, but the cost-to-value ratio is exceptional for teams just getting started with warehouse-based reporting.
Looker. A separate enterprise BI platform (announced acquisition by Google in 2019, deal closed 2020), distinct from Looker Studio. It has its own semantic layer (LookML), governed metrics, and better performance on large datasets. Worth the investment at brands above $20M in revenue with a dedicated analytics function.
Metabase. An open-source BI tool that many D2C teams find more accessible than Looker for non-technical users. The question-based interface allows marketers to build custom queries without writing SQL. Good choice for teams where the primary users are marketers, not analysts.
Which dashboards actually drive decisions?
The mistake most brands make when they first build a BI layer is recreating the dashboards they already had in Shopify — daily revenue, top products, traffic sources. These are fine, but they don't take advantage of what a warehouse-based stack can do. The dashboards worth building:
LTV by acquisition channel and cohort. The most important report in D2C. Rows are acquisition cohorts (customers acquired in a given month); columns are months since acquisition; cells are cumulative revenue per acquired customer. Plot this for customers acquired through Meta vs. Google vs. email vs. organic. Over 6–12 months, you'll see which channels are acquiring high-LTV customers and which are acquiring one-time buyers, regardless of their first-order ROAS.
True channel ROAS with blended attribution. A table showing ad spend by channel alongside revenue attributed through last-click (Shopify), post-purchase survey responses, and platform-reported attribution. Seeing all three side by side gives you a triangulated view of each channel's true contribution, and makes the over-attribution problem visible rather than hidden.
Contribution margin by channel. Revenue minus COGS minus ad spend minus shipping minus platform fees, by channel. ROAS doesn't tell you if a channel is profitable — contribution margin does. A channel running 3.5x ROAS with 40% margins and 12% average shipping cost might be contributing less per order than a channel running 2.8x ROAS with 65% margins on a lower-shipping product.
Subscription and retention health. If you run subscriptions or a loyalty program, a cohort-based retention report — what % of subscribers acquired in month X are still active in month X+N — is the leading indicator of program health. Tracked weekly, it catches churn trends before they show up in MRR.
Inventory sell-through by channel. Which channels are selling which products, and at what rate relative to inventory. This helps marketing align spend with inventory position — increasing spend on fast-moving products that are about to stock out, or shifting spend toward products with excess inventory that aren't getting organic traction. Paired with your Shopify CRO work, this view reveals which PDPs need conversion rate improvement to support spend increases.
What's the weekly operating cadence?
The stack has no value if it doesn't change how decisions are made. Build a weekly analytics cadence around the dashboards:
Monday morning (15 min): Pull up the blended ROAS dashboard for prior week. Check for any channel that moved more than 20% from its 4-week average. Flag for investigation if anomalous.
Tuesday analytics review (30 min): Weekly cohort health check — where does the current week's acquisition cohort compare to prior cohorts at the same stage? Check subscription retention metrics if applicable.
Monthly business review (60 min): Full LTV-by-channel cohort update. Has the LTV trajectory of customers acquired through any channel materially changed month over month? If Meta LTV is declining while spend is flat, that's a strategic signal — not a bidding problem.
Our data analytics work is built around this architecture: getting the right data into the right place, building the models that turn raw data into meaningful metrics, and designing the reporting cadence that makes the data operational. The most common finding in new engagements is that the data exists — Shopify, Klaviyo, and ad platforms all have it — but it's sitting in silos that nobody has connected. Connecting it is the work.
What does it cost and what does it return?
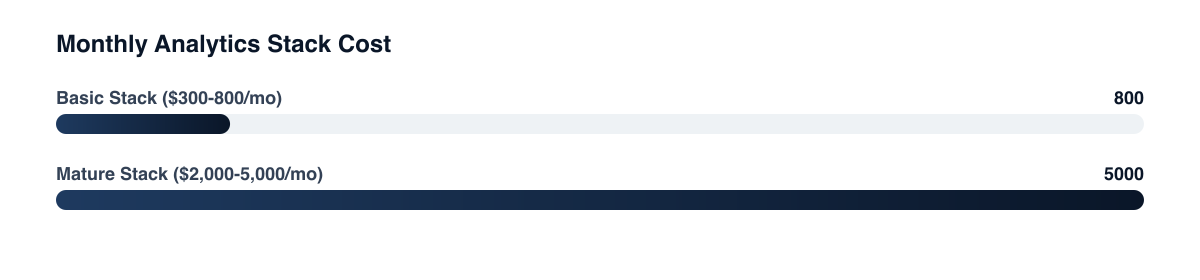
A basic Shopify analytics stack — Fivetran or Airbyte for extraction, BigQuery for storage, dbt Core for transformation, and Looker Studio for reporting — can be set up for $300–$800/month in tool costs (excluding engineering time). A more mature stack with Snowflake, Looker, and premium connectors runs $2,000–$5,000/month.
Related guides
- D2C Analytics and Attribution: The Complete Guide to Measuring What Actually Works
- How to Build a Marketing Dashboard Your CFO Will Actually Love
- First-Party Data Strategy for D2C
- Attribution Modeling 101: Why Last Click Is Killing Your Growth
The return: better budget allocation decisions from accurate channel LTV data, which for a brand spending $100K/month on paid media can easily shift $10–20K toward higher-LTV channels. That shift, compounded over 12 months against a properly modeled LTV, pays for the stack many times over. The constraint is almost never the tool cost — it's the organizational willingness to invest in building and maintaining the data infrastructure before the business questions become urgent.
PART OF OUR SERVICE
Shopify & CRO
Want a free marketing audit?
We'll review your tracking, ad accounts, and funnel — and show you exactly where the gaps are.
Get Your Free Audit →